




Every trading strategy loses sometimes. Even the very very best will, sooner or later, string several losses together in a row. This is what we call a losing streak. But how do you know the likelihood of one happening? That's where a losing streak calculator comes in.
It answers the following question: “Given how often I win, how long a losing streak should I realistically expect, and what would it do to my account?”
It does this by running the trader's strategy through thousands of simulated trading runs and reporting what typically happens, along with the rarer bad cases. The goal is to set realistic expectations, so a normal losing streak doesn't get mistaken for a broken strategy.
Why you should understand losing streaks
Most traders abandon a perfectly good strategy at the worst possible moment: in the middle of an inevitable losing streak. Granted, you should always ensure your strategy is as finely tuned as possible, but the fact remains that you will encounter consecutive losses.
However, this doesn't mean the strategy is wrong, which often forces traders to change their approach or 'strategy hop.' Our losing streak calculator is designed to prevents this. By showing that a run of, say, six or seven losses is completely normal for any given win rate, it helps traders stay disciplined and keep following a strategy that still works.
How to use our losing streak calculator
Every field starts empty with a faint 0 as a hint. Nothing is calculated until the trader enters their own numbers and presses 'Calculate Streaks.'
Here is what each field means:
- Win rate: out of every 100 trades, how many the trader wins on average
- Number of trades: how many trades to look ahead over, such as a season, a year, or a sample.
- Risk (%1): how much of the account is risked on a single trade.
- Risk/reward: how big a win is compared to a loss, e.g., 1:5 means each win is worth 5 times each loss
- Account balance (in dollars): the starting size of the account, used to show the money impact.
After a short calculating animation, the results appear on the right. They are grouped into a few plain sections.
The headline number
The large number is the expected longest losing streak, the typical worst run of losses the trader should expect over the trades they entered. If it says 6, then six losses in a row is normal, not a warning sign. Three smaller figures sit beside it: the average streak across all simulations, the worst 5% (a bad but plausible run), and the worst single run seen in any simulation.
The probability table and chart
The table lists the chance of hitting a streak of a given length at least once. The bar chart shows the same idea visually: how often each streak length appeared across all simulations. The tallest, highlighted bar is the most common outcome.
What it does to the account
The second card translates streaks into money and risk. In plain terms:
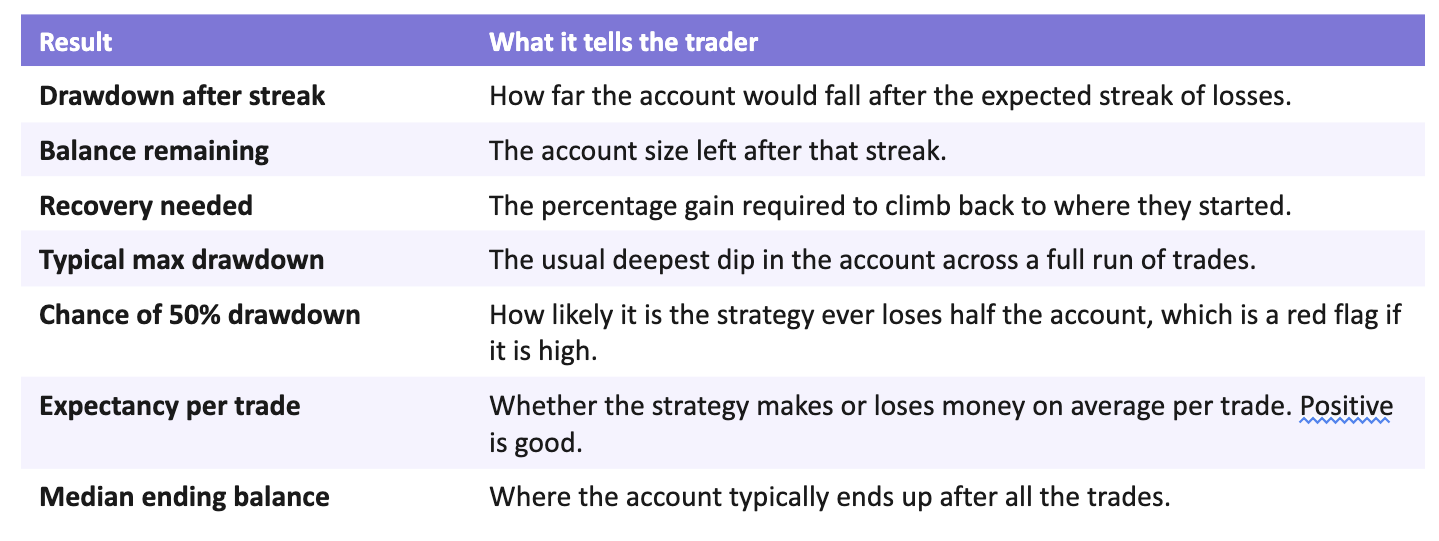
The example run and the reminder
A row of small green and purple ticks shows one example sequence of wins and losses, with the longest losing streak highlighted, so the idea feels concrete rather than abstract. Below everything, a short reminder restates the takeaway in words: a streak of this length is normal, so don't abandon a working strategy because of it.
Managing losing streaks in forex
Firstly, even with the highest accuracy, a losing streak is inevitable. However, it is very difficult when it happens for too long for some traders. You should consider the tips below to help with recovery or to prevent a string of losses from getting out of hand:
- Conservative position sizing: There is a reason why it's generally advised to risk up to 2-3% of your account for every trade. While not a hard-and-fast rule, it's a guideline for trading conservatively rather than aggressively. With 'small' risk per trade, the drawdown recovery is not as steep, meaning that even multiple losses would have a manageable effect.
- Consider the 3-6-9 rule: This rule simply states that traders should risk a maximum of 3% per trade, 6% as the max for all open positions at once, and 9% as the max over a week or month before reviewing what to improve. Of course, you can alter the figures to your preference, but the idea is to have a risk management framework with boundaries.
- Journal your trades: So, if you want to use the 3-6-9 rule, how do you review what went wrong? This is where journaling comes in, an under-rated and often under-utilised skill in trading. The goal is to regularly track your performance, identifying weaknesses and, most importantly, knowing what parameters in your strategy to fix without altering it completely. While you can journal manually, it may be worthwhile to consider software which automates this process, thus saving a lot of time.
- Reduce trading frequency while taking higher-quality trades: Some experts recommend stepping away from the charts during a slump. We actually believe it's better to trade less in general while seeking to capitalise on trades with better quality i.e., adopting a long-term or swing trading style. Better-quality trades have the highest reward potential, which is crucial in growing your account and recovering your balance after a few losses.
FAQs
Why do losing streaks happen?
Losing streaks are a normal part of trading because no strategy wins all the time, given the complexity of financial markets. Even profitable systems experience consecutive losses due to the random distribution of winning and losing trades.
The higher your win rate, the less frequent these streaks may be, but no strategy is immune to them. Understanding this helps traders stay disciplined instead of abandoning a strategy after a few losses.
Should I stop trading completely during a losing streak?
Not necessarily. A losing streak doesn't automatically mean your strategy has stopped working. First, compare the streak with what your trading plan and statistics suggest is normal. If the losses fall within your expected range, it may simply be part of the strategy's natural performance.
However, if the losing streak is unusually long or accompanied by repeated rule-breaking, it can be worth reducing position sizes, reviewing your trading journal, or temporarily stepping back to identify any issues.
What is a good losing streak in trading?
There isn't a "good" or ideal losing streak because every strategy is different. The number of consecutive losses you should expect depends on factors like your win rate, the number of trades you take, and your risk management.
For example, a strategy with a 40% win rate will naturally experience longer losing streaks than one with a 70% win rate. Rather than trying to avoid losing streaks altogether, traders should ensure they are risking an amount that allows them to survive them comfortably.
