


It's often said that history has a way of repeating itself (or at least 'rhyming'). We also know that past performance doesn't guarantee future results. However, in our quest to determine the 'when' of price action in forex, it is hard to ignore currency seasonality charts.
As with any tool, they shouldn't be used on their own. However, when used with other conditions in one's trading strategy, the concept becomes incredibly useful.
Ultimately, seasonal trading charts help us align with the ideal direction for a particular month, identify the best-to-worst performers, and even guide our profit-taking.
Learn more about this concept and how you can use it with our bespoke tool.
What is currency seasonality?
Currency seasonality is a predictable change in currencies that repeats at a specific period (for ease of use, it is best to consider the monthly period). However, we can also identify patterns around certain quarters, seasons, or fixed dates such as tax deadlines, fiscal year-end, or Christmas-New Year.
In simple terms, forex seasonality asks: “Does this currency pair tend to rise or fall during this month?" Here are some seasonal examples of a few popular currency markets to be aware of:
- October has historically been the month with the largest gains for the yen over the past 25 years. However, other bullish months tend to be February to June and September.
- Over the past 10 years, the Australian dollar has proven to be the most bullish in January (it exceeded 5% against the USD alone this year). History also shows that it has performed well in most of the last quarter of the year, at least in the past decade.
- The greenback, or the US dollar, seems to uptick quite a bit in February and, even more so, in September and October.
Why forex market seasonality matters for most traders
Here are the main benefits of considering seasonal influences in your analysis or strategy:
- Directional bias: This is perhaps the greatest advantage. For instance, if your analysis indicates a sell signal on GBP/JPY, even though it is seasonally quite bullish for that particular month, it may be worth considering an alternative.
In this case, you would need strong reasons to stick with the original bearish idea. Of course, a trader can always go against seasonality (especially if the performance is barely noteworthy). However, in other situations where the performance is dramatic, it may be wiser to align with that direction or focus on other pairs.
- Filtering for the best-performing pairs: For forex traders who prefer trading a limited handful of markets (like 1-3), seasonal trading can help identify which have the best profit potential. Generally, minor or cross pairs move further than major pairs. However, seasonality provides data-driven evidence and allows for precise filtering.
- Realistic profit-taking: This point is relevant mainly for swing and position traders. If you plan to hold for a few weeks to a month, you will want to consider the average range of that particular pair.
Although the Average True Range indicator is excellent for this purpose, seasonality provides a historically significant ballpark estimate that is relevant across all time periods. Needless to say, pairs will, in many cases, move further than they did years ago.
If you believe a market can travel beyond its historical average, you might need to adjust your risk- reward accordingly. In this way, you align with both the direction and realistic monthly performance, rather than being overly ambitious.
- Staying away from illiquid periods in the markets: Seasonality is not only about direction. The study of FX volatility has shown that volatility also follows calendar effects. This is why you'll hear being advised against trading during certain days like some holiday periods.
These include most of December, leading to the New Year, the European summer season, Golden Week in Japan, and the Chinese New Year. Here, wider spreads and increased price volatility are common as liquidity dries up, leading markets to react more easily to large orders and causing sudden price spikes.
Core drivers of currency seasonality
Unsurprisingly, a combination of factors contributes to currency seasonality. These include global trade cycles, corporate dividend payouts, tourism, and tax deadlines.
Companies engage in currency buying and selling based on quarterly and yearly business cycles. Fiscal-year-end effects significantly influence these currency flows. Countries with different fiscal calendars exhibit unique seasonal patterns in currency behaviour.
Commodity prices also matter. Currencies like the Canadian dollar and Australian/New Zealand dollars often see shifts linked to summer season energy and mining demand. Harvest seasons cause dramatic shifts in commodity exports, impacting currency demand for nations reliant on agriculture. Exporting nations often see their currency strengthen during agricultural harvest and export seasons due to increased demand.
Tourism peaks lead to increased demand for local currencies as tourists exchange money for expenses during peak travel periods.
Finally, tax deadlines trigger capital movements, resulting in temporary influxes or demands for specific currencies.
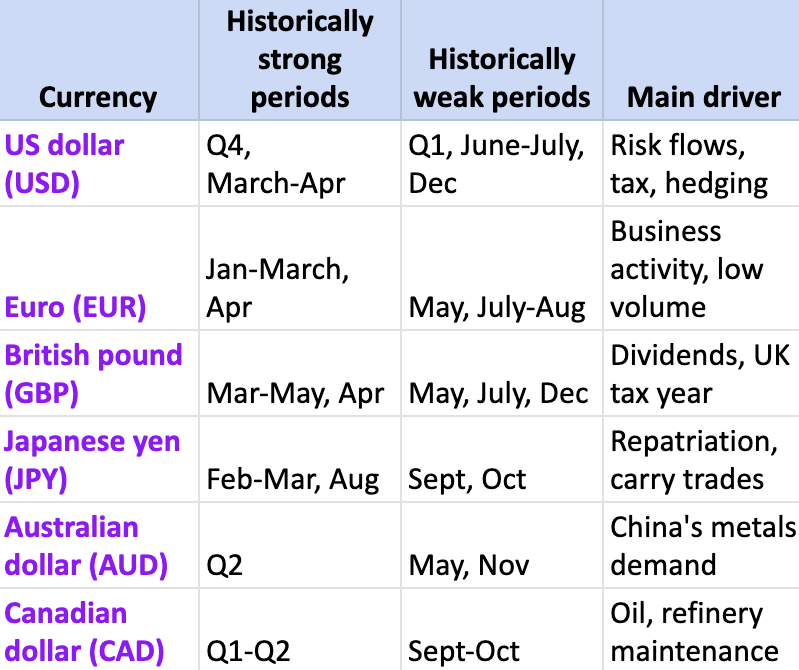
Major seasonal patterns in key currencies
Below are common seasonal tendencies for most standalone major currencies based on historical averages.
With FX being more global, faster, and automated, the conditions have also evolved to the point that any time-based or seasonal trends are easily overridden. A crisis, war, surprise rate decision, or central bank intervention can erase even a strong seasonal edge.
Thus, you shouldn't solely rely on seasonality. Use it as one of many confirmation factors, alongside other robust indicators, to build more solid trading ideas.
How to use our seasonality charts
Firstly, our seasonal charts are based on 10-year averages. Although it is possible to create data laid out beyond this period, the FX is far less volatile now compared to 15, 20, or 25 years ago. Thus, 10 years is a 'reasonable sweet spot.'
When using our charts, it's best to always start with your initial 'triggers' when formulating a trading idea and to consult this data for an additional layer of confirmation. If the direction and performance align with your potential setup, you can then think of how bullish or bearish that market is for that month.
For instance, if the pair has moved 0.15% (but has historically reached 0.69%), this offers guidance on your targets.
If the seasonality doesn't align with your entry setup triggers, that doesn't necessarily mean you should disregard the position. However, you might consider other correlated markets whose direction and performance align with the initial idea.